صور المظاهر بواسطة MichaelJay. يتم التشغيل بواسطة Blogger.
أقسام المدونة :

الأربعاء، 20 مايو 2015

How to construct a geological map?

Before constructing a geological map it is important to be clear out about the aims of the investigations, for this decision will guide the choice of map scale and control the nature of the techniques which are needed to cover the area in detail to resolve the problem.

Well what is a geological map?.

A geologic map portrays the distribution of rocks, deposits, or other geologic features in a specified area. Each consolidated rock type that can be distinguished by similar characteristics is categorized into a mappable unit, or formation. Unconsolidated deposits such as landslides and stream alluvium also are designated on our geologic maps. Unique colours, patterns, and labels are used to differentiate each unit on the map. Colours are chosen by the age of the rocks being described. For example, rocks from the Jurassic Period are coloured in shades of green, and Quaternary deposits are coloured shades of yellow. Labels designate the age and name of the formation or deposit. A geologic map is typically printed over a topographic base map.

Many different types of lines and symbols are found on geologic maps. The most prevalent are thin black lines that depict the contacts between two different mappable units. Line width and colour are used to differentiate other types of features such as faults and folds. Geologists collect structural information describing whether the rock layers are tilted or not. Most sedimentary and volcanic rocks were originally deposited horizontally. Therefore, the tilt (dip) of layered rock units may provide key information to understanding whether non-horizontal units were deformed by faulting or folding. This type of structural information also helps geologists build interpretive cross-sections that depict how the map units may look in the subsurface. Geologic maps provide a wealth of information to all who use them. They are important for geologic hazard detection and mitigation, mineral and groundwater resource evaluation, and provide enjoyment for the casual roadside geologist. Geologic maps help us understand the earth on which we walk, and give us a greater appreciation for the geology around us.


First of all you have to mark your area in Google Earth and save it as KMZ file by right clicking the area folder and then click save places as KMZ.

Location of study area.

Then Mark your formations with polygon and save it as KMZ file by right clicking each formation.

Formations polygons being made.
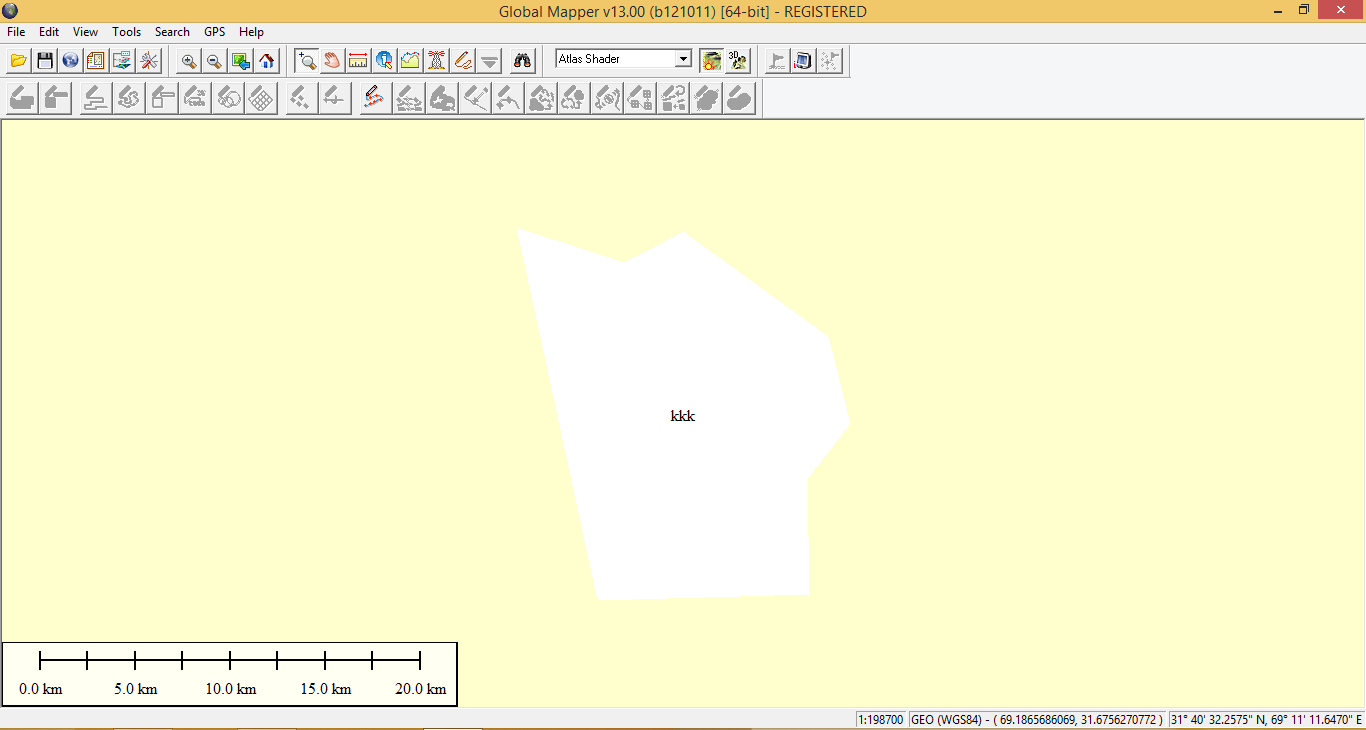
Now open each file in global mapper and export it separately into Arc GIS shape file by clicking File > Export Vector format > Shape file.


Location area in global mapper.
First polygon in global mapper.


Second polygon in global mapper.


Third polygon in global mapper.


Now you can open it in Arc GIS as shape file for GIS already been created. Now it will look like this in GIS.


All data when loaded in Arc GIS.

So now what you have to do  when all being loaded?.

Simply complete your map, You can add the formations name which will self name at what you saved in the Google Earth. You can label by simply clicking each polygon by right click and label features. Now what else is missing?. This map is already being geo-referenced from the Google Earth moreover click on the insert and add legends, North arrow, Co-ordinates etc what ever is your need suit yourself. This is how you can make geological map using Arc GIS. You can also use Coral Draw for constructing map.

الأحد، 17 مايو 2015

What are earthquakes and what causes them?


Earthquake

An earthquake is the brittle, sudden failure of the earth's crust or mantle. Earthquakes are caused by several factors however the common element is that stress builds in rocks until the yield strength of the rock is exceeded, at which point rupture occurs. The relative movement between the major tectonic plates is responsible for the stress build-up that causes the vast majority of earthquakes.

To understand the earthquake process some simple physical quantities should be defined first.


Stress is the force per unit area.
Elastic deformation: A material changes shape when stressed but after the stress is removed, it returns to its original shape. The bonds between the molecules and atoms of an elastically behaving material, when stressed, stretch and bend, but retain memory of their original configuration. Once the stress is released, the stored energy is released and the material returns to its original shape examples are rubber band or super ball and rocks
Brittle deformation: Rupture occurs in response when stress that is exerted on the material exceeds that materials yield strength example are glass, ceramic and rocks
Plastic deformation: Flow occurs in response to stress and material does not return to original shape after applied stress is removed. Just like a Play Dough which can be shaped as liked. Some rocks (rock salt or halite) and other evaporites flow when subjected to stress.

How does elastic rocks break?. 


It can be best understood by the following example of a plywood. When the strip of plywood is subjected to a bending force, it deforms elastically at first. If the bending force is released, the wood returns to its original unbent shape. However, if the bending exceeds the yield strength of the weakest part of the wood, that part will rupture. Once the rupture occurs, we all hear the cracking noise - this represents the propagation of acoustic energy through the air due to the rupture. In other words, the rupture releases energy into the surrounding medium and this energy spreads away from the point of rupture. The farther that one is located from the point of the rupture, the softer the rupture noise is because that finite amount of energy released by the cracking wood is being spread over a larger volume as it moves away from the source.

Fault breaks which results in earthquake

So how does earthquake occurs in the crust?

In the earth's crust and in particular, within the fault zones that accommodate the motion between the rigid interiors of plates, the crust deforms elastically between earthquakes. The faults have geometric irregularities (bends) that prevent the crust on either side of the fault from slipping smoothly (creeping) in response to the steady state motion of the plates on either side of the fault. Because friction prevents steady state slip along a fault, rocks near the fault deform elastically in response to plate motion far from the fault. Once the amount of elastically stored energy exceeds the strength of the weakest area of rocks along a fault, that patch of the fault ruptures. At the point of rupture, rocks on either side of the fault slip to their new location and in the process, release lots of stored energy that propagates away from the point of rupture. A small rupture in one area of a fault can place a sudden strain on a nearby, more strongly locked section of the fault and cause that section of the fault to rupture, too. Thus, one earthquake can trigger another. Faults often have bends; the rocks on the fault face can have different frictional and elastic properties; fluids may lubricate the fault; and other nearby faults may change the local stresses.

Once an earthquake has occurred along a section of a fault, much of the stress on those rocks is relieved. However, since steady state plate motion is still occurring, stress immediately begins to build again, leading to the earthquake cycle in which repeat earthquakes occur along sections of a fault. The frequency and strength of earthquakes along a given fault depends on how quickly the stress builds, how weakly or strongly the fault is locked in a particular region, and interactions with other nearby faults that are also responding to the stress build up. This makes it difficult to to model the earthquake cycle.

Rupture and propagation of seismic energy

To understand the propagation of seismic waves one can demonstrate it by throwing a stone into a pond. Well ripples on the pond carries energy away from the point of impact. Some of the energy is also carried down into the pond as sound, which we could hear if we were beneath water when the stone was thrown. In a similar fashion, during an earthquake rupture, two broad categories of seismic waves are generated.
  • Body waves, which carry seismic energy through the interior of the earth
  • Surface waves, which carry seismic energy along the surface.
  • Body waves can be further sub-divided as follows:
  • P wave (primary) is Compressional. Particles displaced in direction of energy propagation
  • S wave (secondary) is Shearing. Particles displaced perpendicular to direction of energy propagation.
Surface waves, which cause the earth's surface to roll as they pass by are often responsible for the majority of earthquake damage. Surface wave amplitudes can reach several meters, meaning that during a large earthquake, one end of your house could be in the trough of a surface wave several meters beneath the other end of your house which could be surfing on the crest of a surface wave. Surface waves travel slowly often take several minutes or longer to travel tens of miles. Body waves arrive within seconds but aren't as likely to cause major shaking.

Why are seismic waves useful?

Seismic waves are useful for locating earthquakes, determining the amount of energy that was released, and determining what type of fault slip occurred. Seismologists routinely exploit this information using a global network of seismographs that continuously feed their readings into several analysis centres. Earthquake locations (epicentres) and magnitudes are typically available less than an hour after an earthquake. 

To find the location, three things required to completely describe the location of an earthquake 
  • Its latitude 
  • Its longitude 
  • Its depth. 
These three together describe the earthquake focal point, which is the point within the earth where an earthquake started to rupture a fault. The point on the earth's surface directly above the focus is called the epicentre.
Magnitude: The magnitude of an earthquake measures the total amount of ground shaking produced near the epicentre. There are many scales to measure the magnitude of an earthquake but the most used one is Richter scale Richter magnitudes vary from 1 to about 9, with 1 being very small and 9 being enormous. In general, an increase of 1 point in the magnitude represents a 10X increase in the amount of ground motion and a 31X increase in the amount of energy release.
Intensity: An alternative way to measure the size of an earthquake is by its effect on humans and surface features such as buildings. This technique has shortcomings because it depends on the often subjective observations of individuals. However, for earthquakes that occurred before regular instrumental recording made it possibly to routinely estimate earthquake magnitudes, estimates of intensity are the only way to locate epicentres and determine how large the earthquake was. 

Earthquake Risk factors

  • Fault movement: direct breakage of structure built on fault trace.
  • Ground Shaking: ground vibration caused by seismic waves travelling away from focus.
  • Landslide: ground shaking can induce failure of weak slopes.
  • Liquefaction: ground shaking of wet soil can induce creep of soil.
  • Tsunami: disturbance of sea floor causing seismic sea wave.
  • Fire: rupture of gas lines etc.

How do mountains build?

Plate moves around the Earth's surface which exerts powerful lateral forces on rocks. The response of the crust to those forces gives rise to deformation on a large scale, particularly along plate boundaries. For example, dozens or hundreds of large-scale faults can form in zones of plate convergence, resulting in a broad and high mountain belt. The geologic processes that can result in mountain building.
  • Crustal shortening/thickening in response to convergence of a subducting plate.
  • Continental collision.
  • Uplift of sediments accreted by subduction.
  • Volcanism.
  • "Corner" accretion/uplift due to along-trench rafting of terrain.
  • Heating or cooling of lithosphere by the underlying mantle (and hence uplift or subsidence).
  • Crustal extension.
Geometrically, if two plates are colliding, they can respond as follows:
  • One plate can subduct into the mantle.
  • One or both plates can undergo shortening and hence uplift and crustal thickening.
  • One or both plates can undergo lateral extrusion (i.e. part of the plate escapes the collision zone by extruding sideways).
Let's consider the first two cases.
Suppose an oceanic plate converges with a continental plate. The oceanic plate, being more dense, subducts into the mantle. If all convergence (100%) is accommodated by subduction, the overlying continent will remain undeformed and should undergo no net uplift (although topography will undoubtedly develop as arc volcanoes appear). Suppose that not all convergence is accommodated by subduction and a few percent of the convergence instead causes the upper plate to shorten. How much uplift is implied?

For 100 millimetres per year of convergence (a typical plate velocity), if 5% is accommodated by long-term shortening of the overlying plate, then the overlying plate will shorten at a rate of roughly 5 millimetres per year.


Geometrically, the 5 mm/yr of horizontal shortening translates into vertical motion as shown above, with the only dependence being on the dip of the fault along which the continent is shortening. For low angle faults (10 degrees), uplift will occur at rates of about 1 mm/yr (1 kilometre per million years). Over 5 million years, this amounts to uplift of 5 kilometres or 3 miles (15,900 feet). Over the same period, the two plates will have converged some 5 million years x 100 kilometres per million years or 500 km. The total uplift then is only a small percentage, 1%, of the total horizontal motion.

Continent-continent collisions are not usually accompanied by subduction because both plates are too buoyant to be thrust deeply into the mantle. The amount of crustal thickening and uplift in such a collision can thus be much greater than for an ocean-continent collision. For example, over the past 40 million years, continental India has driven northward into continental Eurasia across the Himalayas mountain belt at a rate of about 40-50 millimetres per year. If you work it out, this implies that the two plates have somehow shortened by more than 1500 kilometres (about 900 miles) across the Himalayas. Since subduction is not occurring, the shortening has been accommodated by mountain building and lateral escape.

Factors that complicate calculations of total uplift

Plate convergence of hundreds or even a thousand kilometres or more over millions of years might be accompanied by only several kilometres of uplift. This uplift, while spectacular to the eye, is merely a small part of the displacement "budget", which is largely dominated by horizontal motion.

Many important aspects of mountain building are ignored and thus cannot predict total topography given total horizontal motion.

Why is this the case?. It is because of the following:

  • Fault dips are rarely well known and faults are often curved, with their dips increasing toward the surface.
  • Erosion/mass wasting removes material from the upper reaches of uplifting regions, sometimes nearly as quickly as the region is going up!
  • Vertical uplift must fight the downward pull of gravity. In extreme cases, no amount of horizontal convergence is capable of causing further uplift.
  • Crustal uplift often coincides with subsidence through a process called isostatic adjustment. This is analogous to climbing into a boat, which sinks lower into the water once your weight is added to that of the boat. Your net height above the water surface is equal to your height on land minus the amount the boat sinks. Continents similarly sink into the underlying mantle when substantial topographic loads are added to their surface.
  • Lateral escape of crust sometimes accommodates a significant fraction of plate convergence, leaving less available for inducing vertical uplift.
  • Uplift can occur simultaneously or sequentially along many faults that exist in a broad zone of deformation between two converging plates. Relating the total horizontal convergence to the total uplift caused by the convergence then requires measurements across many faults.

الأربعاء، 6 مايو 2015

Mud volcano endangers life as lava flow

Mud volcano is referred to formations created by geo-exuded slurries which also includes water and gases. Mud volcanoes produces no lava flows but instead are limited to slurries and water or gases. The mud produced by mud volcanoes is most typically formed as hot water, which has been heated deep below the earth's surface, begins to mix and blend with various subterranean mineral deposits, thus creating the mud slurry exudate. This material is then forced upwards through a geological fault or fissure due to certain local subterranean pressure imbalances. Mud volcanoes are associated with subduction zones and about 1100 have been identified on or near land. The temperature of any given active mud volcano generally remains fairly steady and is much lower than the typical temperatures found within igneous volcanoes. Mud volcano temperatures can range from near 100 °C (212 °F) to occasionally 2 °C (36 °F). Mud volcanoes may range in size from merely 1 or 2 meters high and 1 or 2 meters wide, to 700 meters high and 10 kilometres wide. Smaller mud exudations are sometimes referred to as mud-pots. The largest mud volcano structure, Indonesia's Lusi is 10 kilometres (6 mi) in diameter.
Lusi mud volcano devastation.
On 29 May, 2006, a new mud volcano erupted in the Sidoarja regency of East Java, Indonesia. It buried villages and farmland in an area of nearly six square kilometres. Lusi is unlike other mud volcanoes in the way that it erupted with a continuously high flow of mud expelling at high temperature. The discharged mud now covers an area of 5.6 kilometres square and is being confined by man made earth embankments that surround the volcano on all sides.
Lusi mud volcano devastation.
Initially, more than 100,000 tonnes a day was oozing to the surface. It is the biggest mud volcano in the world; responsibility for it was credited to the blow out of a natural gas well drilled by PT Lapindo Brantas, although some scientists and company officials contend it was caused by a distant earthquake.
At its peak Lusi spewed up to 180,000 m³ of mud per day. By mid August 2011, mud was being discharged at a rate of 10,000 m³ per day, with 15 bubbles around its gushing point. This was a significant decline from the previous year, when mud was being discharged at a rate of 100,000 cubic metres per day with 320 bubbles around its gushing point. It is expected that the flow will continue for the next 25 to 30 years. Although the Sidoarjo mud flow has been contained by levees since November 2008, resultant flooding regularly disrupt local highways and villages, and further breakouts of mud are still possible.

السبت، 2 مايو 2015

The most active volcanic region on Earth

Most active Volcanic Region

Iceland is the most active volcanic region on Earth located in the Atlantic ocean between Greenland and Norway. It is a landmass that is part of a much larger entity situated at the junction of two large submarine structures, the Mid-Atlantic ridge and the Greenland-Iceland Faeroes Ridge. Iceland is located where the Asthenospheric flow under the north east Atlantic plate boundary interacts and mixes with a deep seated mantle plume. The buoyancy of the Iceland plume leads to dynamic uplift of the Iceland plateau and high volcanic productivity over the plume produces a thick crust.
Iceland is one of the most active volcanic regions on Earth where almost all types of volcanic and geothermal activity can be found. The volcanism on Iceland is the contribution from both the Iceland plume hotspot activity and the Mid Atlantic Ridge activity. The Mid Atlantic Ridge as the name indicates is the ridge forming from volcanism in Atlantic ocean but however it is also visible on land. Iceland's landscapes are forged by the processes of volcanism. The volcanic landscapes include rift valleys, geysers, hot springs, rhyolite mountains, columnar basalt formations, lava fields and lunar like craters. Subglacial volcanism has created table mountains in northern and southern Iceland. Iceland sits spanning the Mid Atlantic Ridge tectonic plate boundary which separates the Eurasian and the North American plates. The ridge, and underwater mountain chain extended about 16,000 km along the north-south axis of the Atlantic ocean. A rift valley running along its spine is formed by plate tectonics and it's the locus of new crust formation. Molten lava from beneath the Earth's crust constantly comes up, cools and is pushed away from the ridge flanks which widen the gap between continents in the process. Iceland formed by the coincidence of the spreading boundary of the North American and Eurasian plate with a hotspot or mantle plume. As the plates moved apart, excessive eruptions of lava constructed volcanoes and filled the rift valleys. Subsequent movement rifted these later lava fields causing long valleys bounded by parallel faults. The divergence of the ridge started in the north about 150 million years ago and 90 million years ago in the south. These movements continue today accompanied by earthquake, reactivation of old volcanoes and creation of new ones. 

Stokkur Geyser, Iceland
Strokkur is located less than 100 metre away from Geysir and it erupts frequently every 4 to 8 minutes. Strokkur is a fountain geyser. It is one of the very few geysers that erupts regularly spouting steaming water up to 20 meters. 

Why do geysers occur?

Well geysers occur in high temperature geothermal areas within the zone of active rifting and volcanism where temperature in the subsurface sis higher than 200 Celsius at less than 1 km depth. The temperature of the hot springs is up to 100 Celsius and some are constantly boiling. If the temperature at depth rises above boiling, the hot springs erupt which means that they are geysers. Geysers eruption occurs when boiling water within the geyser trapped by cooler water above it explodes forcing its way to the surface.

Katla volcano, Iceland
Katla volcano is located near the southern end of Iceland's eastern volcanic zone and is hidden beneath the Myrdalsjökull icecap. Katla is one of Iceland's most active and most dangerous volcanoes, infamous for its large eruptions happening on average every 50-100 year causing devastating glacial floods. Well its been quiet now for a long time but in recent year, increased seismicity and inflation of Katla has been measured. Katla statistically due for a new eruption but an eruption is not too distant would not come as a big surprise.

الجمعة، 1 مايو 2015

Hawaiian islands can exceed the current count

Hotspot
Hotspots or hot spots are region of active volcanism where mantle feeds the hotspot with magma. The magma rise in the hotspot from mantle to crust. It readily meets the crustal plates and as hotspot comprises of hot magma, it starts to melt the above lying crustal rocks. Some areas can be easily accessed by magma as rocks are not hard enough that can bear the hot magma and doesn't rapidly melt and some rocks can be melted easily. Several minerals have high melting point while some have low. This melting point of minerals suggest the rock either to quickly melt or takes time to break the point. When magma start melting so it rises into the crustal rocks. Some places takes little time to break and magma rises to the surface. This is just the case of the Hawaiian islands where static hotspot point is below the islands.
Hawaiian islands
The Hawaiian Islands are at the south eastern end of a chain of volcanoes that began to form more than 70 million years ago. Many of these volcanoes formed islands that have subsided and eroded beneath sea level, and some of the old volcanoes probably never reached sea level. Each Hawaiian island is made of one or more volcanoes, which first erupted on the sea floor and only emerged above the ocean's surface after countless eruptions. As there are series of islands comprises collectively of Hawaiian. All islands are the result from a single static hotspot. The hotspot feeds the surface with lava which starts to build a ridge. The ridge when fed a lot rises above the surface water and form an island. Well how does series of islands have formed with some distance?.
This can be understood by plates drifting. Hawaiian islands are on pacific plate that is most active oceanic plate. As a a ridge reaches the surface and makes an island, due to the Pacific plate movement it drifted away from the hotspot. The hotspot magma rise to the surface again by breaking the plate and starting building again an island which was then drifted away so the series of Hawaiian islands formed. 
The Hawaiian islands forming hotspot is still active and as of the Pacific plate movement. This will allow the generation of more islands adding to the Hawaiian series.

الأربعاء، 29 أبريل 2015

San Andreas fault can still hit major earthquake

San Andreas Fault

San Andreas fault aerial view
San Andreas fault is a continental transform fault extended over an area approximately 810 miles through California state. It is a right lateral strike slip fault with plate boundary with Pacific plate and North American plate. The fault has three segments where each segment has different characteristics and can originate a different degree of earthquake risk. The most significant being the southern part because it passes through 35 miles of Los Angeles. The name San Andreas is from the San Andreas lake which is a small body of water that was formed in a valley between the two plates. Transform fault is the sliding boundary between two plates. In San Andreas fault there are much of the fractures and faults associated with it which marks the zone where these two plates meet. San Andreas fault is about 28 years old when these plates first interacted. These plates are slowly moving along each other.


San Andreas fault map showing locked and creeping zones
The two plates are siding with each other at the rate of a couple inches through the year. This rate of movement is spectacular and can develop significant amount of strain with the boundary of the two plates. As shown in the photograph, there are areas which are marked red that is locked down and no movement is along them nowadays and the blue shows the moving area of the fault. As the locked up places does feel the stress but due to stuck plates, no movement is being caused in these areas. But this will never be the same but instead when stress is greater then it can accommodate, one day it will show abrupt movement as was in 1906 earthquake when sudden movement was approximately 21 feet on the areas which were locked. Lets have a look back at the earthquakes generated by the San Andreas fault preserved in the history. 

Earthquakes from the San Andreas fault

The first recorded earthquake from the San Andreas fault is in 1769 then was in December 8. 1812 killing forty persons. Later in January. 1857 which was severe shock then is in October, 1868 killing thirty persons. Then is in March 1872, killed 27 people and on April 19, 1892 Vacaville was damaged. On Christmas day in 1899 six person died because of earthquake from San Andreas. Then the giant earthquake of April 18, 1906 which killed 700 people including total damage of $500 million. Damage of $1 million was done by June 22, 1915 earthquake $200,000 in April 1918. Other are in June 1925 with damage of $8 million, November, 1927 earthquake, March 1933, May 1940 and July 1952. All earthquakes were severe some more and some less damage causing. 

Latest study of the San Andreas fault

Of the hundreds of seismogenic (earthquake causing) geologic faultsin California, UCERF (Uniform California Earthquake Rupture Forecast) classifies only six faults as Type A sources, meaning there is sufficient information to both estimate and model the probability of a Magnitude (M) 6.7 or greater earthquake within 30 years. These six faults are the: (1) San Andreas (split into northern and southern sections, (2) San Jacinto, (3) Elsinore, (4) Garlock, (5) Calaveras, and (6) Hayward-Rodgers Creek. Faults which are known to be slipping (and therefore seismogenic) but lack sufficient information to fully model how close they might be to rupture are classified as Type B. About twenty of these faults are estimated to have a 5% or greater chance of an M ≥ 6.7 earthquake within 30 years. An additional six areas where strain is accumulating but where knowledge is insufficient to apportion slip onto specific faults are classified as Type C sources.

There is additional chance of earthquakes on faults that were not modeled, and of lesser earthquakes. Northern California has an estimated 12% chance over the same 30 years of an M ≥ 8 mega thrust earthquake on the Cascadia subduction zone. UCERF has also prepared "participation probability maps" of the chance that any area will experience an earthquake above a certain magnitude from any source in the next 30 years.

Interested for our works and services?
Get more of our update !